


Technoloy
Abstract:
MIOC is considered as one of the main critical components of FOG (1). The method of characterization of integrated optic chip for FOG applications is important for the development of MIOC. In this paper we describe the method and configuration of MIOC characterization set up. The test results of MIOCs viz coupling/splitting ratio, Insertion loss, Polarization extinction ratio, bandwidth, residual intensity modulation, mode field diameter, numerical aperture are presented.
I. Introduction
Integrated optical chip consisting of Polarizer, Y-branch Power splitter & Combiner and Phase modulator plays a key role in the development of Closed Loop Fiber Optic Gyroscope. This is largely due to the advantages offered by this technology, including the potential for multifunctional optical circuit integration, small size, and weight, high speed, low voltage operation, low loss, compatibility with single mode fibers and potential for low cost mass production.
In general certain performance criteria are required for high performance integrated optical device and the materials for which they are made. These criteria includes
● Feasibility and ease of optical wave guide fabrications
● Low optical loss at the wavelengths of interest
● High electro- optic coefficients to meet low voltage requirements
● Low dielectric constants to meet high speed requirements
● High optical damage threshold
● DC bias stabilityl Compatibility with efficient fiber coupling and reliable attachment
● Performance reliability and environmental stability
● High volume manufacturability at low cost
In addition to these general requirements, there are certain specific requirements for Gyroscope applications
● Highly polarizing element integration
● Low intensity modulation in the phase modulators
● Low back reflections
Since the first fabrication of indiffused waveguides in LiNbO3, this material has been extensively used in integrated optics research. It became possible to simply fabricate low loss waveguide in the ferroelectric material LiNbO3 which has excellent electro-optic and optical properties. The emergence of single mode fiber as the dominating optical transmission medium in early 1980’s further increased the interest in LiNbO3 integrated optic devices since they, like most other waveguide devices, basically require single-mode operation to be efficient.
One of the basic methods to make optical waveguides in LiNbO3 crystal is proton exchange (PE). The PE technique produces high quality waveguides in LiNbO3 depending upon the fabrication parameters; it can produce either small 0.02 or 0.01 % index variation. In such process the extraordinary refraction index increases while ordinary refractive index remains the same. As a result the proton exchange waveguide supports only extraordinary polarization modes. Therefore it reduces the use of additional polarizer in fiber optical gyroscope, which brings additional loss. In spite of the simplicity of proton exchange process; the LiNbO3 devices exhibits complex structural chemistry as per structural phase diagram. This paper reports the measurement of effective refractive index, mode indices, internal loss, and v-pi using Fabry perot technique.
II. Theory:
LiNbO3 integrated optic devices incorporate light guiding channels in the LiNbO3 crystal with higher refractive index than the surrounding medium. The manipulation of light is based on the electro-optic effect
∆Bij = rijEk |
(1) |
Where rij is the electro optic tensor and Ek is the electric field |
|
Further: |
|
Bij Kjk = δik |
(2) |
Where B and K are the dielectric impermeability and permeability tensors, respectively. The change in refractive index is derived from the change in dielectric constant tensor. Thus an applied voltage perturbs the indicatrix
In an X-Cut Crystal LiNbO3 the refractive index change is as: ∆n=-(1/2) n333 r33 Ez
This sets the boundary condition for LiNbo3 IOC’s since device operation relies on index change and requires:
ko L∆n=π
Where ko =2π/λ
The electronically controlled index change can be used for phase modulation, and the phase modulation in turn is used to generate amplitude modulation as : interferometeric(mach zender) or phase match control (directional coupler).
Fabry-Perot Measurement
Assuming reflection R of the light from the chip-air interface, a Fabry-Perot (FP) interferometeric picture between two interfaces of the chip results. The Fabry-Perot interference technique enables the simultaneous gathering of both waveguide phase shift and waveguide internal loss information, regardless of the laser input power or coupling efficiency. Figure shows the waveguide as a Fabry-Perot cavity.
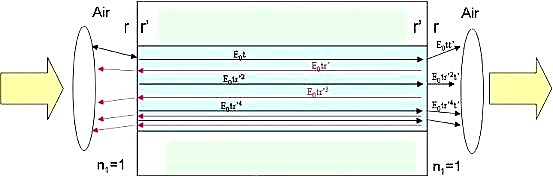
Figure 1: Waveguide as a Fabry-Perot Cavity
The Fabry-Perot interferometer is a special case of multiple beam interference. With regard to the optical field amplitude at the output of the waveguide,
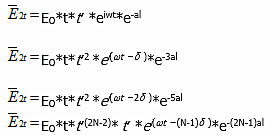
WhereE0 eiω t the incident is wave and δ = 2kn l is the difference in phase arising from the two travel paths along the waveguide.
The phase difference is a combination of the optical path length difference, and the phase shift added in the waveguide. e−α l is the total waveguide loss from mirror to mirror. r,t,r',t' are reflectance(transmittance) coefficients from the air-chip and chip-air interfaces, respectively. The condition for total constructive interference occurs where:
mλ = 2n f L
Wherem is an integer number, λ is the wavelength, n f is the refractive index of the medium, and L is the medium length.
The condition for total destructive interference occurs where:
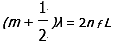
Modulation between constructive interference and destructive interference can be achieved either by modulation of the wavelength or modulation of the refractive index.
Refractive Index Calculation
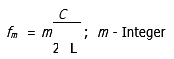
The relationship between frequency and wavelength is
f= c / λn = c. n / λ
and the derivation is
∆f= (c n / λ2 ) ∆λ
Where n is the refractive index and ∆ λ is the pick-to-pick length.
However, the frequency expression of standing waves is
Where L is cavity length.
Consequently,

and therefore,
Mode Field Diameter
Mode field diameter is the expression of the distribution of the irradiance (the optical power per unit area) across the end face of a single-mode fiber. For a Gaussian power distribution in a single-mode optical fiber, the mode field diameter is the diameter at which the electric and magnetic field strengths are reduced to 1/e of their maximum values. This is equivalent to the diameter at which the power is reduced to 1/e2 of the maximum power since the power is proportional to the square of the field strength.
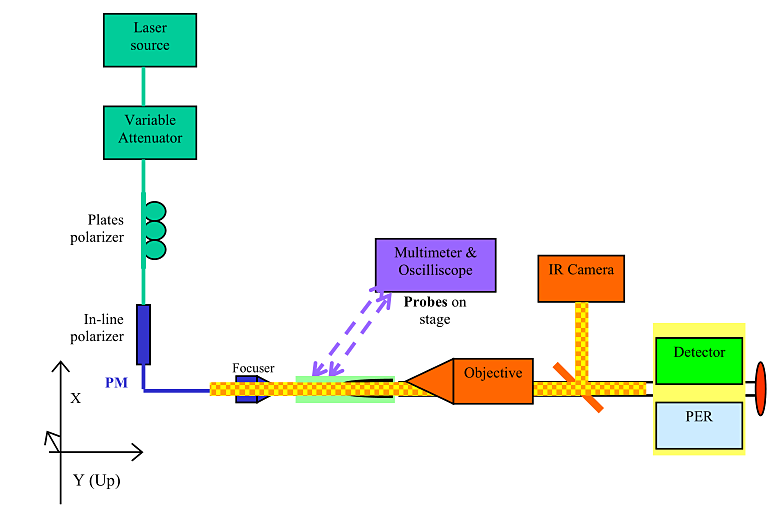
The setup described above is used to measure the optical mode; insertion loss, Polarization Extinction ratio (PER), Electrical response like V-2pi etc.
The chip is placed on the translation and rotatory stage where the two polished chip end forms the Fabry -perot cavity. The light source is launched into the waveguide using focuser thereby the output is collected at the detector to measure the loss; and the optical mode is seen at IR camera to decide whether the waveguide is single mode or multimode. The mode field diameter is measured along X-axis and Y-Axis Scan using the intensity pattern generated using IR camera. The Gaussian fit is used to determine the 1/e2 value of the power irradiated by the chip to give the measure of Mode Field Diameter. The Light collected from the Chip output is detected at PER meter to give the Polarization Extinction ratio to characterize the extinction ratio property of LiNbO3 device. The electrical response is measured by placing the electrical probes on the electrical pads of LiNbO3 device and the performance of device and modulation property are measured. The refractive index is measured from the mode indices of the waveguide.
IV. Test Results:
The optical Mode inspection shows whether the waveguide is single mode or multimode using IR Camera grabbed mode profile. The mode profile of the wave guide measured is as follows:
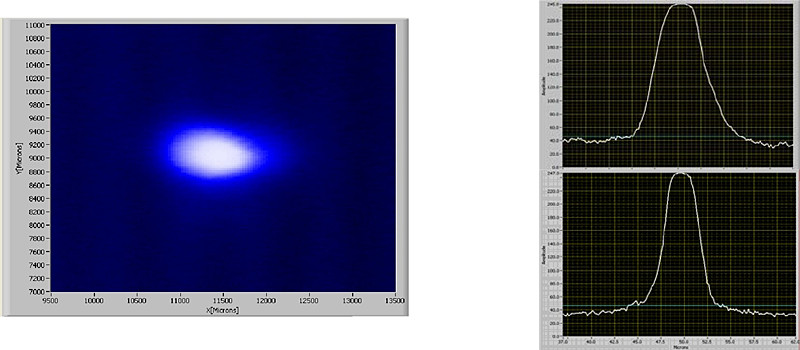
he Mode field Diameter of the LiNbO3 single waveguide is: 3.9 um along X -Axis and 2.7 um Along Y-Axis.
The test results are summarized as:
Parameter |
Waveguide |
MFD along X-Axis |
3.9um |
MFD along X-Axis |
2.77um |
No. of Mode |
1 |
NA along X-Axis |
0.11 |
NA along Y-Axis |
0.154 |
Loss (dB) |
-5.2 dB |
Refractive Index |
2.15 |
PER (dB) |
41.7 |
V. Conclusion:
The characterization of MIOC with single waveguide channel is presented to measure several critical parameters using Fabry-Perot based test station. This station measures all the critical parameter of the LiNbO3 based device to ensure its performance in the fiber optic gyroscopes. The test station is intended to carryout the work for measurement of Y-branch integrated optic chip to be used in all closed loop fiber optic gyroscopes.
VI. References:
S.Ezekiel & H.J.Arditty,“ Fiber Optic Rotation Sensors”, Springer-Verlag, New York, 1982.
J. Oliver’s, M. A. Diaz-Garcia and J. M. Cabrera, “Direct Measurement of Ordinary Refractive Index of Proton Exchanged LiNbO3 Wave-guides”, Optics Communication, Vol. 92, pp- 40-44, 1992.
K. K. Wong, A. C. G. Nutt, D. F. Clark, J. Winfield, Prof. P. J. R. Lay bourn, and R. M. De La Rue, “ Characterization of Proton-Exchange Slab Optical Wave-guide in X-cut LiNbO3”, IEE PROCEEDINGS, Vol. 133, Pt. J, No. 2, pp- 113117, 1986.
© FOGphotonics, inc. | Company | Products | Technoloy | Contact us